Infographic design makes complex data manageable and fun to consume. It’s an excellent way to share the latest business data in a creative way that’s easy to understand. So let’s look at 20 creative Infographic designs.
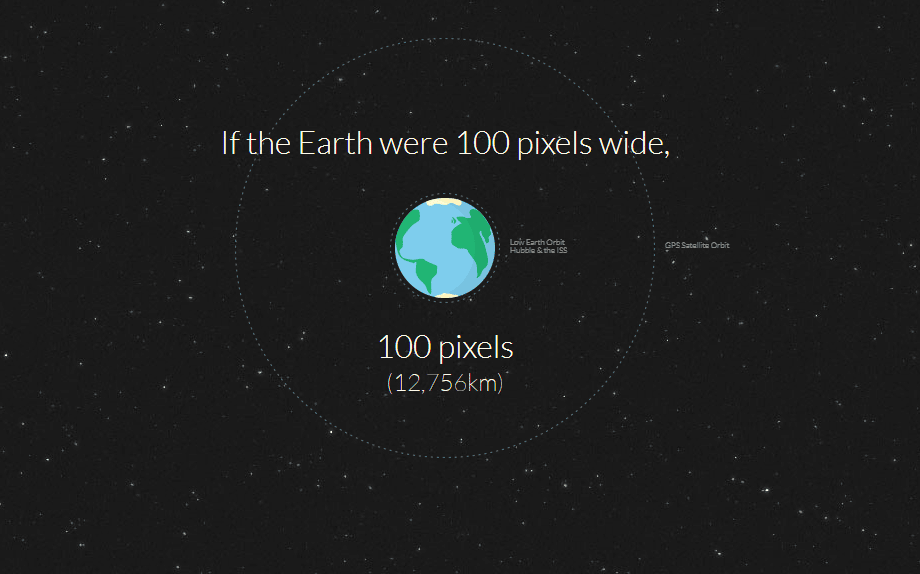
1. Distance to Mars :
It shows the distance to Mars and the Moon in terms of the number of pixels required to create a picture of them on a computer screen.
2. Spot Cafe Menu :
With a series of icons and vibrant colors, this infographic design offers a fun and effective way to advertise a menu.

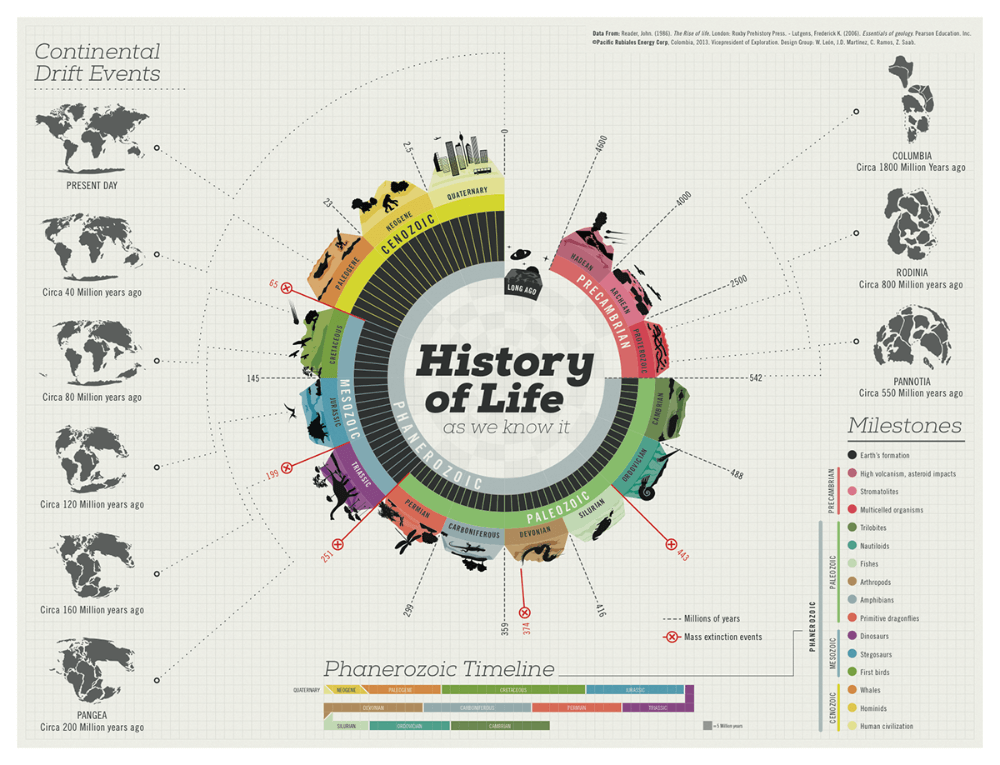
3. History of life :
This infographic will teach you about how there were mass extinctions and times when the planet was quite similar to what it is today.
4. Nature And Us :
This Infographic design explores how changes to the environment, climate, and water resources are impacting the things we love.

5. Ecomobility-Electric Vehicle :
The most effective method is the use of electric cars. This graphic helps you to decide what car best fits your everyday needs.
Young bodybuilder, 20, died after ‘taking cocktail of drugs bought from dark web’ | The Sun proviron benefits fitness educator: bodybuilders on steroids lucky to live past 45

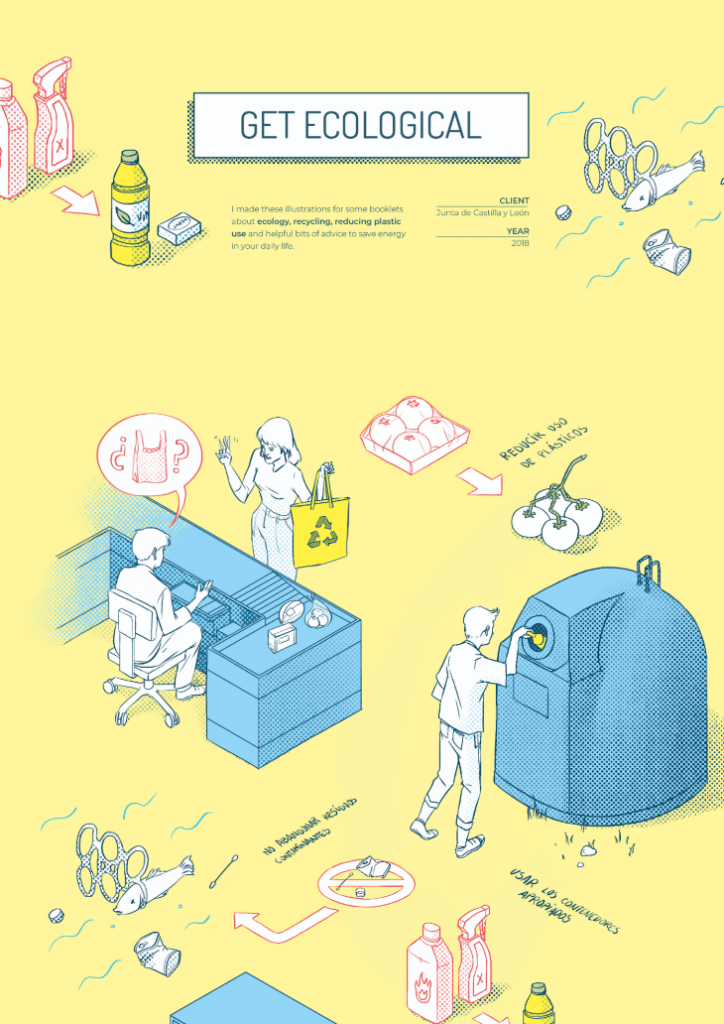
6. Get Ecological :
How to be more eco-friendly? This infographic design shows you how you can do your part. Pretty cool, right?
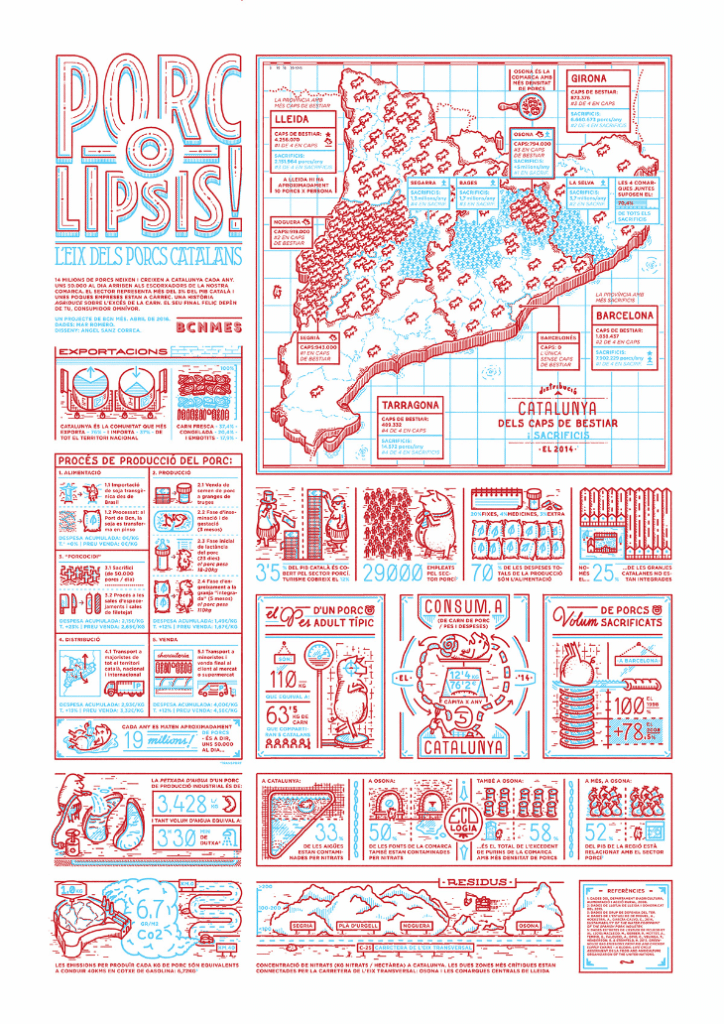
7. POROCOLIPSIS Infographic:
The infographic takes you on a journey through the local pork industry in Catalonia, examining its history, trends, and challenges.
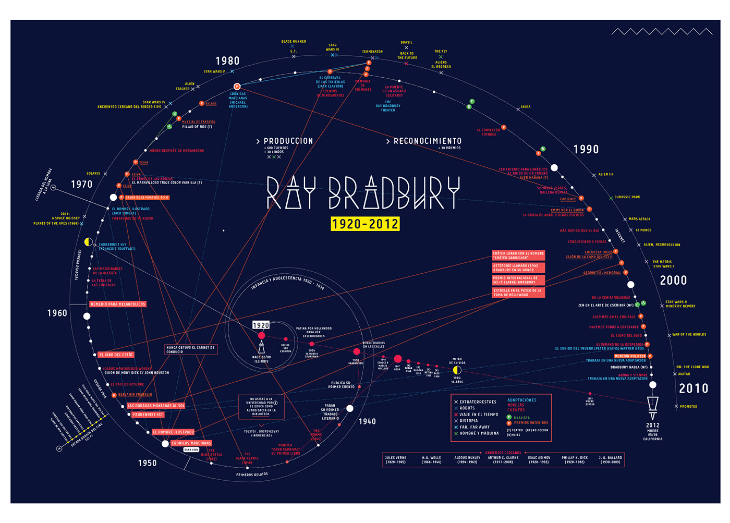
8. Ray Bradbury Timeline :
An amazing infographic design of the life story of Ray Bradbury, presented in a series of graphical lists.
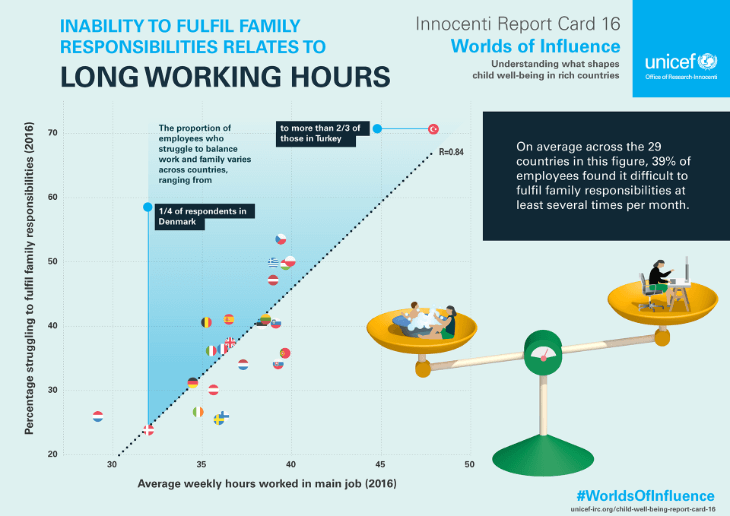
9. UNICEF Report Cards :
Take a look at what children in different countries (with very different GDPs) go through every day.
10. Chit Chart :
With facts and stats about everything from educational systems to healthy eating, this easy-to-consume infographic design can do it all.
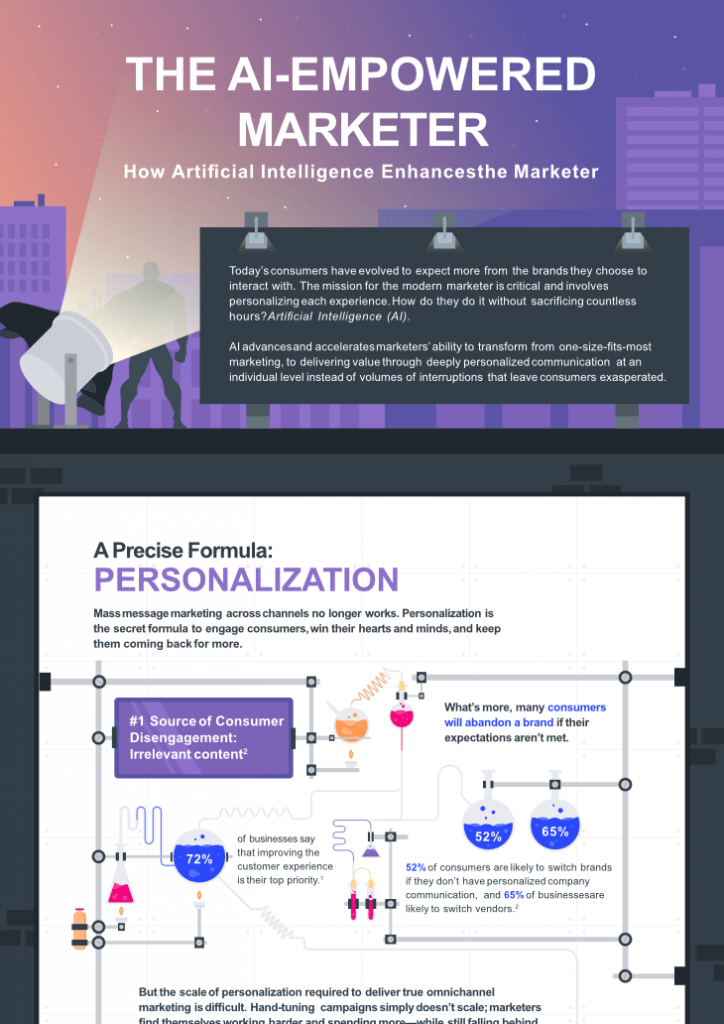
11. The AI-Empowered Marketer :
If you’ve been thinking about AI and the marketing field, the following infographic is a fun and educational read.
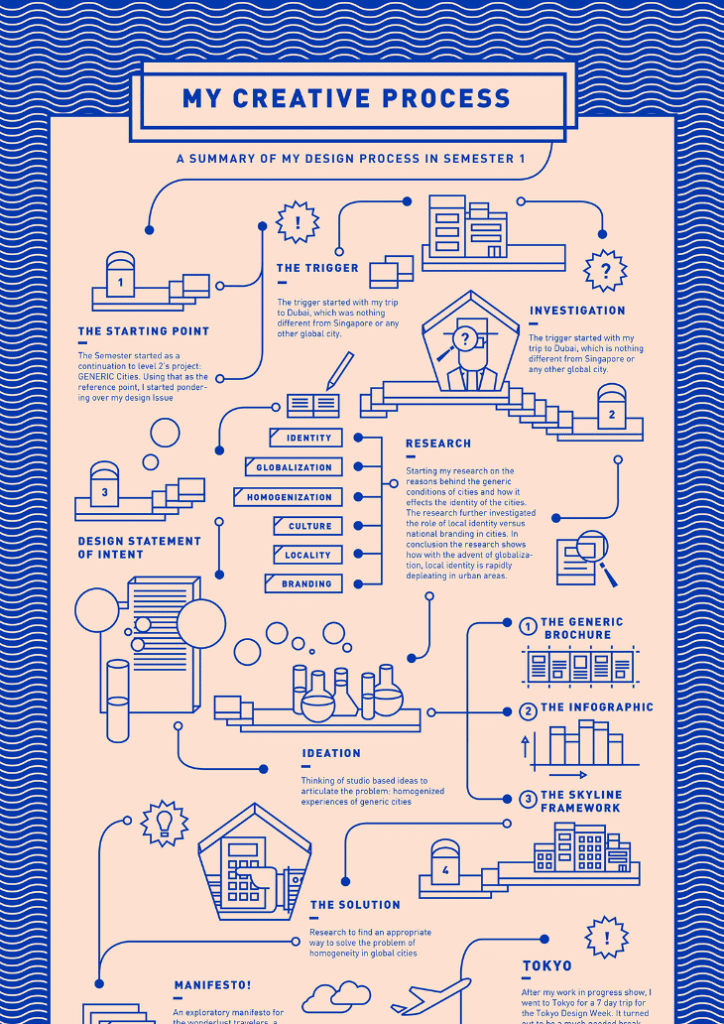
12. Creative Process Chart :
This information graphic clearly demonstrates the development process in a unique and engaging way.
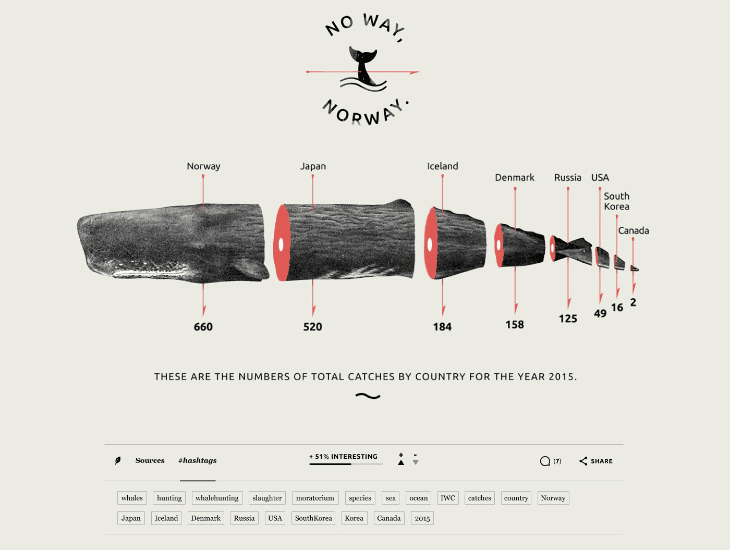
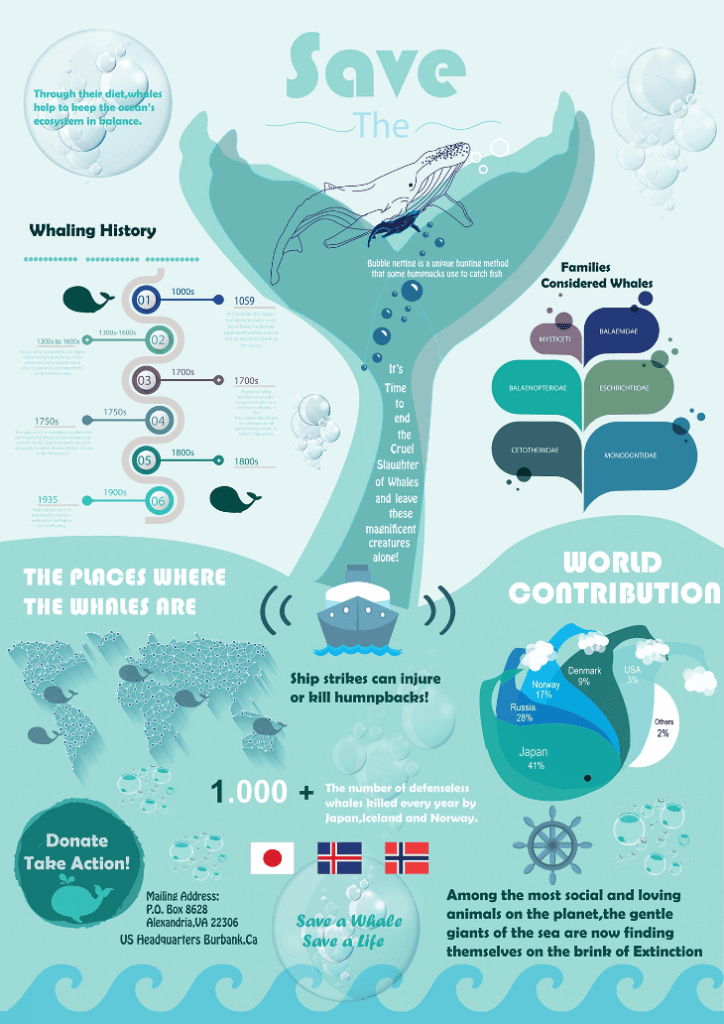
13. Save The Whales :
Big whales are big animals that can be found in lots of different places. They are generally friendly.
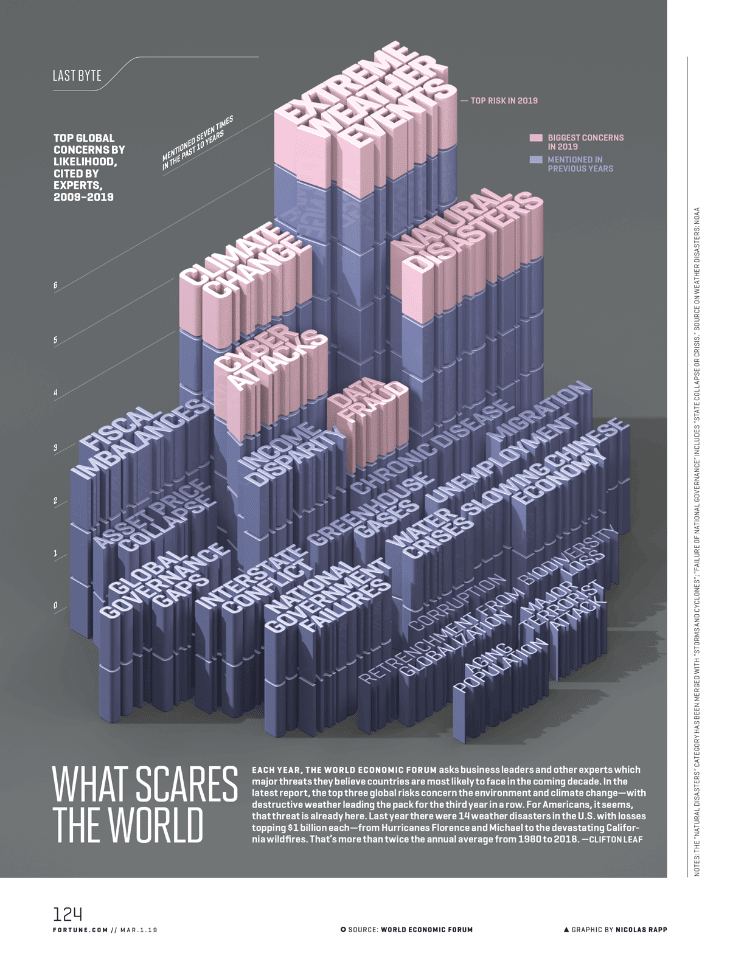
14. What Scares the World :
The World Economic Forum surveyed people about the most pressing issues facing the world. This is what they said.
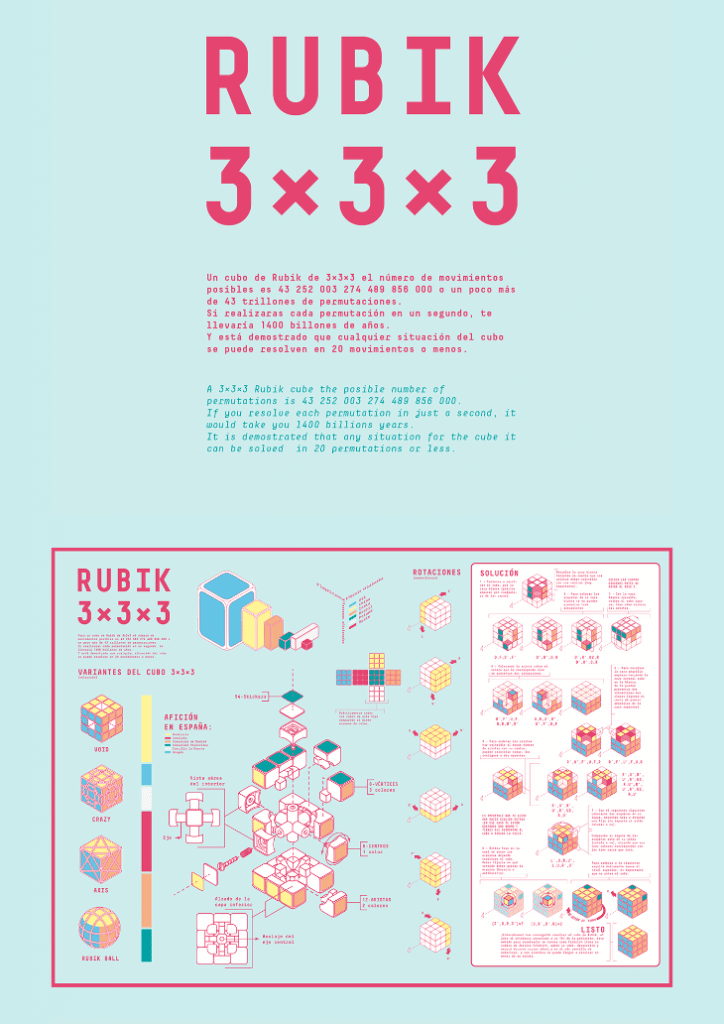
15. RUBIK 3x3x3 :
Solve the Rubik’s cube with this interactive infographic design that shows you exactly how to do it.
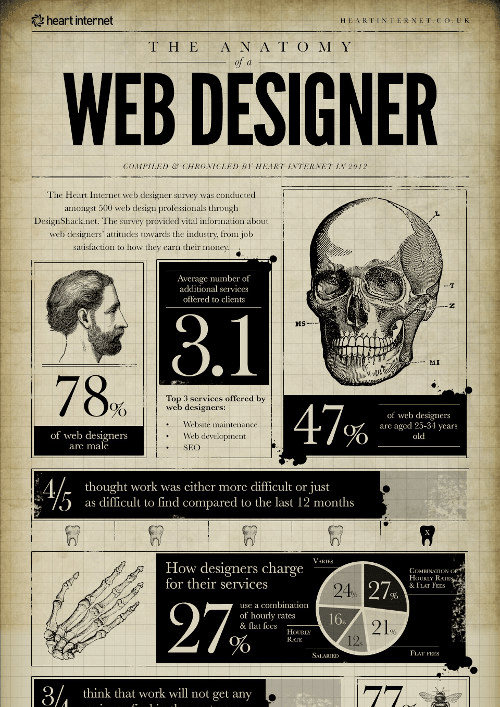
16. The anatomy of a web designer :
An infographic design based on the surveys the web designer carried out and the results of it.
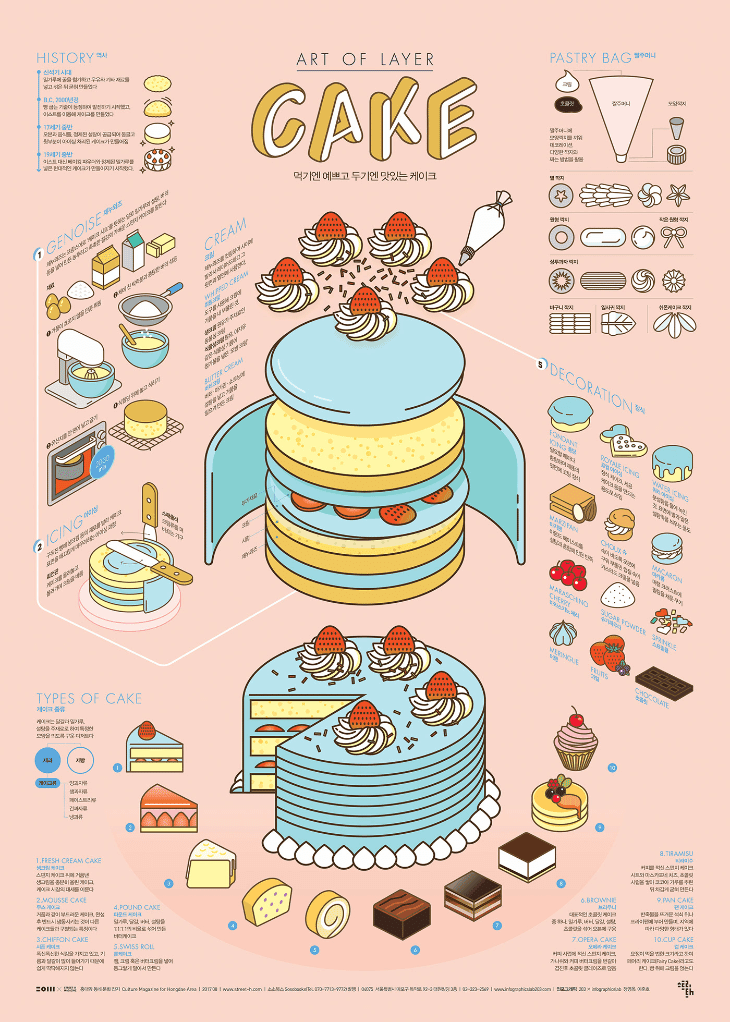
17. Cake Infographic Poster :
This infographic takes you on a journey through cake history. Joyful, celebratory cakes are stacked high to form a timeline that chronicles the evolution of cake.
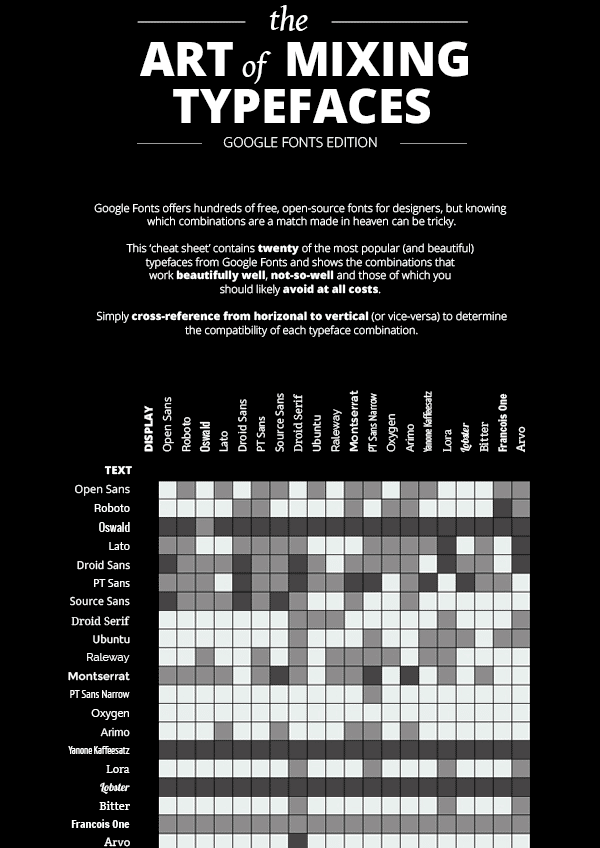
18. The Art Of Mixing Typefaces :
With this dynamic Diagram Cheat Sheet, we make it easier and more understandable to use and understand Diagrams.
Source
19. Is Workplace Culture Overrated? :
It’s difficult to give an exact number for any culture, but it can be measured by the quantitative information that the organization has.

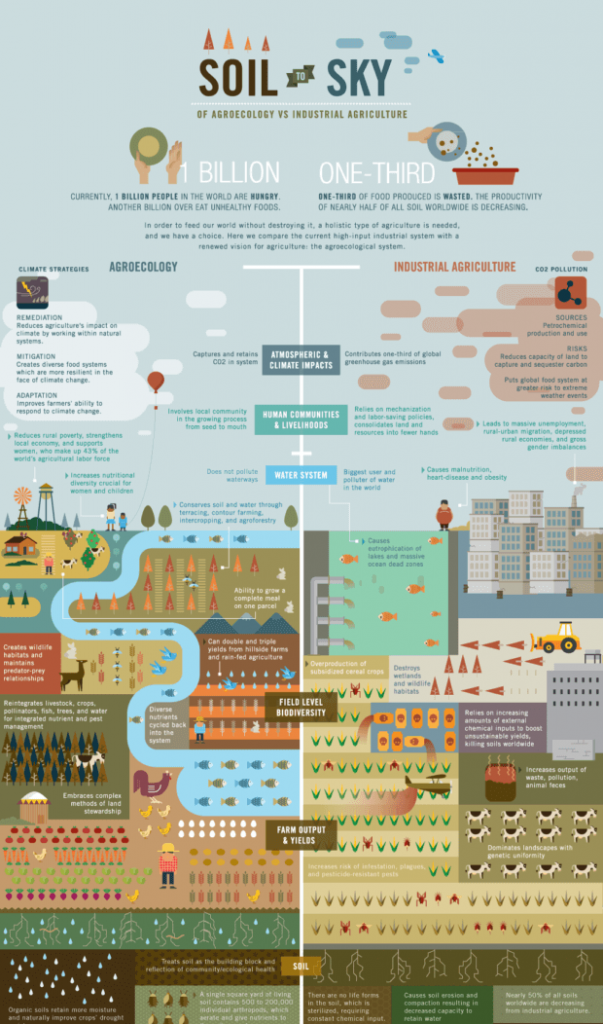
20. Agroecology vs. Industrial Agriculture :
Want to take a closer look at the two solutions to the world’s food crisis? You can in this infographic design.