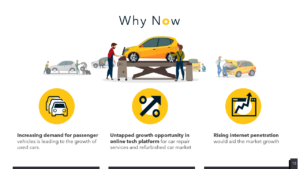
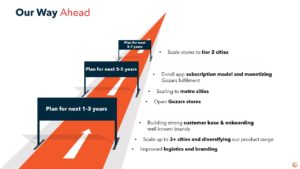
Infographics are a best way to present content to your audience in an engaging, and interesting format.
Creative Infographic design is a fun and effective way to engage with audiences by illustrating information graphically. It can help people understand complex data more easily. An eye-catching infographic design will encourage people to read your graphic and take action. The detailed graphics and smooth animations will help you make an impact and be easy to understand by your audience.
Strategic Storytelling through Infographic Design
Infographic design services are a comprehensive and dynamic approach to protecting and preserving your company’s competitive edge. Infographic design agencies use infographics as a catalyst for strategic storytelling, dedicated to strengthening the visual content of your investment story as it is presented to investors, partners, customers or all-important stakeholders along the way. Van York is committed to ensuring your message is heard loud and clear by the targeted audience. Infographic design PowerPoint can help you understand better about the presentation.
What are Infographics
Before going further, let’s evaluate what we mean by infographics.
Infographic design is a subset of information graphics. Infographics are an effective way to deliver your market analysis and communicate insights. They are an excellent tool for communicating your vision. The goal is to simplify complex data and information into visual representations that are easier to digest and understand. The two main properties of infographic design tool are:
An Essential Analytical Tool
Infographics can express information quickly and clearly. They can summarize and make comparisons easier for our audience. Infographics design visually displays data. Graphics are used to portray information in a clear, concise manner. If you’ve ever found yourself looking at a chart with so many numbers that you can’t make sense of them, that “chart” may be an infographic. Infographics are very useful and important in keeping your business on track and profitable.
The Value of Visual Cues
Well-designed infographic design balances the need for clarity and simplicity with visual appeal. Through imagery or symbols, an infographic can bring technical information to life. The best designs will engage and guide your audience through the information presented. A chart or timeline can help organize information. Even to incorporate fun symbols like arrows or emojis to assist the reader in absorbing the data.
Market Research
An accurate market analysis is essential to formulate a solid business plan and investor pitch. From understanding market size to finding local trends, we compile all relevant information so that you can focus on what matters – growing your business. Today, most investors start not by scrolling through a report but by searching for certain terms or sector groups. Getting to the top of the results can be challenging for mid-sized companies without marketing budgets compared to the big boys in the industry.
Visual Content
Visual content is an effective way to tell a brand’s story and connect with your clients. Whether you’re using a simple infographic design to display research discovery or a dynamic video full of rich data, visual content will help you make a lasting impact with your potential investors.


